How To Find Out What’s Taking Up Space On Your Hard Drive With WinDirStat

Alright, you’re out of space. Maybe you just need a few more megabytes (or even gigabytes) of hard drive space to install your latest computer game, or to accomodate that ever-growing, business-critical database. Maybe your hard drive is actually, literally, filled to capacity. Maybe you’ve uninstalled everything you were willing to get rid of, and even some things you weren’t, and it’s just not enough–you need more space! Now what?

WinDirStat is here to save the day! WinDirStat is a free program that scans your hard drive and creates a visual representation of what’s hogging all of your precious bytes. After starting up the program, you choose which drive or drives you want to scan, and then you’re given a color-coded map where each section represents a folder. The biggest files correspond to the biggest squares, so you can quickly track them down. Hovering over a file with your mouse cursor shows you exactly where it exists in the directory tree, and right-clicking allows you to open Windows Explorer at the relevant location or even a command prompt with that folder as the current working directory. It’s incredibly useful for tracking down files you didn’t know you had–whether they are pictures or music files that you forgot about or lingering remnants of a program you already uninstalled.

Personally, I tend to find operating system images that I put in an obscure place, giving me the opportunity to free up a gigabyte or two. I’m also a bit of pack rat when it comes to game save files and I keep hundreds of saves when I play through a game like Skyrim just in case I want to come back to any point in the game, perhaps before a particular event or before I offed an important character. Sometimes these files can be a few megabytes a piece, so do the math and you’ll realize that 300 saves adds up quickly. Please remember to be absolutely careful when deleting files from your computer. Make sure they are not critical system files and do research on anything you’re not 100% sure about deleting. Another personal suggestion I have is to avoid scanning multiple hard drives at once, because their visual representation shares the same space and the smaller files can get drowned out.

You can download WinDirStat from www.windirstat.info. Additionally, instructions on how to obtain alternate software for Linux and Mac are available on the site.

How To Use Wireshark on a Mac to See 802.11 Headers and Find Wireless Devices

In this post, we are going to use the Airport NIC on a Macbook Pro or Air in order to view 802.11 and Radiotap headers using Wireshark. Utilizing the Airport card we can gain access to some useful layer 2 wireless information including signal strength, channel frequency and data rate, and see interesting packets such as beacon frames as well. Let’s have some fun!

The first step is to own a Macbook Air or Macbook Pro with an Airport card. Unfortunately, the vast majority of laptops natively running Windows won’t allow you to see layer 2 wireless information, as it is a restricted function of the NIC. You can technically still get access to the same information with a Windows laptop, but you’ll need a third party device such as Riverbed’s AirPcap. Spoiler alert: they are pretty expensive!

The next step is to download Wireshark from www.wireshark.org. Wireshark is a packet analysis tool–probably the best in the industry–and it has the added benefit of being free and open source! I’m using Wireshark version 1.10.6 on Mac OS X 10.9.3 (Mavericks) for this tutorial. When you launch Wireshark for the first time, it will need to configure a graphics utility named XQuartz in order to run, and that can take several minutes. While we are waiting, let’s make a configuration change that will allow us to interact with the Airport card.

Mac OS X has a built-in command line utility that will allow us to configure the Airport card, but it’s not in an easy to access place. We’re going to fix that by typing the following command in Terminal:

sudo ln -s /System/Library/PrivateFrameworks/Apple80211.framework/Versions/Current/Resources/airport /usr/sbin/airport

Let’s break down the command:
sudo – run the following command as the root user
ln – create a link from the second file to the first file
-s – supplied to the ln utility to denote that this will be a “symbolic” link. That means when we refer to /usr/sbin/airport, it points to /System/Library/PrivateFrameworks/…/airport, but we don’t need to disturb the current location of the file.

The last piece of important info is that we created the symbolic link in the /usr/sbin directory, which allows us to run the command without having to specify the full path. In other words, now we have an airport command. Neat!

If you type airport by itself and press enter, you will receive some information about using the airport utility (for any other use of the airport command, we will need to type sudo in front of it to run it as the root user). We are most interested in the -z and -c arguments. For instance, if you type sudo airport -z, it will force disassociation with any wireless networks that the Mac is connected to. We need to do that first in some instances so that we can specify what channel or frequency of traffic we want to capture with the -c command. This is because the Airport NIC can only capture traffic from one frequency at a time, so if it is associated with a wireless SSID, you will be forced to capture traffic on the frequency that SSID is operating on. In order to capture traffic on the most common 2.4 ghz channels, we can type sudo airport -c1, sudo airport -c6, or sudo airport -c11 in order to capture traffic on channels 1, 6, or 11 respectively. We can also select 5 ghz channels, with sudo airport -c157 for example. See more about wireless network channels here: http://en.wikipedia.org/wiki/List_of_WLAN_channels.

Screen Shot 2014-08-30 at 9.10.17 AM

Hopefully by this point Wireshark is ready to launch, so spin it up! When it opens, you will see a list of interfaces on the left-hand side of the screen, such as “Wi-Fi: en0”, and “Thunderbolt1: en1” (if you have a Thunderbolt port). Double click on “Wi-Fi: en0”, make sure the boxes are checked for “Capture packets in promiscuous mode” (capture packets that aren’t addressed specifically to our Mac) and “Capture packets in monitor mode” (allow us to see 802.11 and Radiotap headers), then choose “OK”. Now start a new live capture by clicking the green shark fin near the top left of the Wireshark window. If there are any wireless devices communicating on the frequency that your Mac is listening in on, you should begin to see packet data in the middle pane. If you don’t, try changing the frequency using the terminal commands in the previous paragraph. Remember that you will not see any traffic if you are not tuned into a wireless channel that is in use near your Mac.
Screen Shot 2014-08-30 at 9.27.42 AM

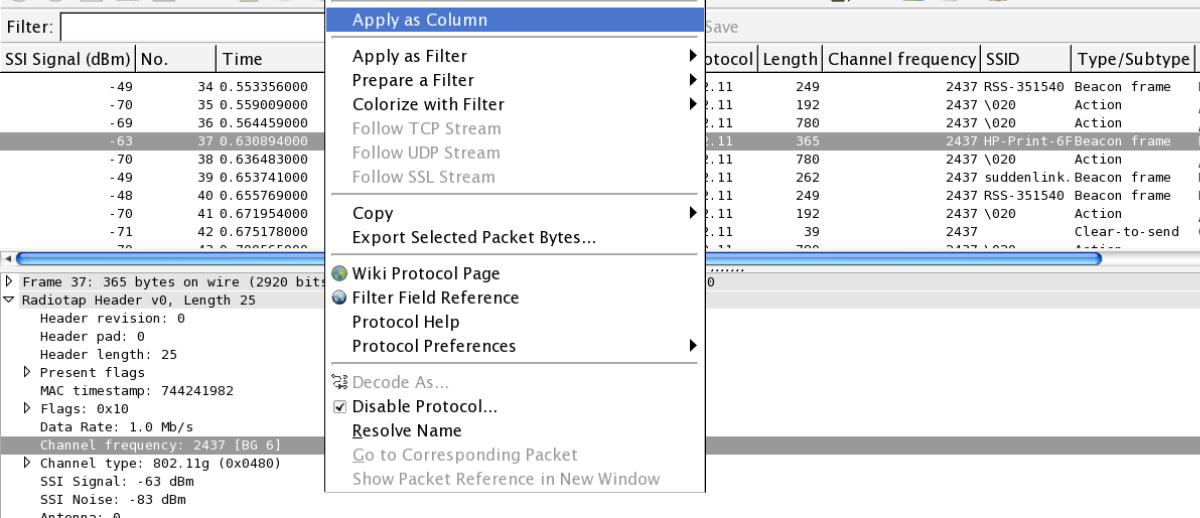
The default columns don’t reveal much of the information we are seeking, so let’s edit them. If the packets are scrolling by too fast for you, click the red stop button near the green shark fin button you clicked earlier. Click on one of the packets in the packet list pane so that the packet is horizontally highlighted, then move your attention to the pane below which is known as the packet details pane. Click the little arrow to the left of “Radiotap Header …” and you should see some information such as “Data Rate”, “Channel frequency”, “Channel type” etc. Some interesting pieces of information we may wish to add to the available columns are the channel frequency and SSI signal. The channel frequency is the actual frequency number which corresponds to the short channel name. For example, channel frequency 2437 corresponds to channel 6. SSI stands for “Signal Strength Indicator” and this value tells us how strong the received signal was on a particular packet. If we ignore the negative sign, we can simply say that the lower the number, the better the signal strength is. For example, an SSI of -60 indicates a stronger signal than -80. To add these pieces of information as columns, right click on each field and select “Apply as Column”. Now this information is easily accessible from the packet list pane and we won’t have to dig for it in the packet details pane. If you’d like to rearrange your columns, feel free to do so by left clicking the column name and dragging it left or right.

Let’s add two more columns. Find a beacon frame by scrolling through the packet list pane until you see one that has “Beacon frame …” in the Info column. Select the packet and left click on the arrow beside “Radiotap Header …” again in the packet details pane so that the information collapses. Now left click on “IEEE 802.11 Beacon frame …”, right click the first field which is “Type/Subtype” and apply that field as a column. Collapse “IEEE 802.11 Beacon frame …” and expand “IEEE 802.11 wireless LAN management frame” by left clicking their respective arrows. Expand “Tagged parameters”, then expand “Tag: SSID parameter set: …” if it is not already expanded. Right-click on “SSID: …” and apply that field as a column. At this point we can see the 802.11 frame type as well as the SSID which originated each packet. If you stopped your packet capture earlier, you can start it again by clicking the green shark fin again.

Now, what can you do with this setup? I have used it to track down printers which are broadcasting their own wireless networks in corporate environments, as well as to track down access points whose physical location was undocumented. You could also use it to locate rogue devices or any wireless client such as a laptop or cell phone. To hone in on a particular device, find a packet which has originated from it, right-click the MAC address of the device in the “Source” column and choose “Apply as filter > Selected”. This will filter out all captured traffic in the packet list pane so that only packets with a matching source MAC address will appear. While you have a live capture running, you can see a very clear indication of how close your laptop is to the device by examining the SSI Signal column we added earlier. In my experience, -80 to -90 indicates a device which is pretty far away but could still be in the same building, -60 to -80 may indicate that you are within 50 feet of a device, -40 usually means you are pretty much in the same room with the device, and -10 to -20 is seen when you are inches away from the device. Take these numbers with a grain of salt, as the power of the source radio and the construction of the building may alter your expected SSI’s. I have also found that pointing the Apple logo on the back of your Mac straight at a device will guarantee the best SSI, so you can use that to your advantage when searching for devices.

Why You Shouldn’t Allow root Login for SSH

A few years ago, a team of students and I did some research on my university’s honeypot network and put together a little presentation about what we found. For those not in the know, a honeypot is a purposefully exposed network system intended to either divert the attention of hackers from production systems or gather information about how hackers compromise systems and the tools they use to do it. While we did gather some information about various default ports that were scanned and attacked, the main focus of the project was on SSH. By using Kippo, a specially designed SSH honeypot service, we were able to acquire information about the usernames and passwords that were used to make SSH connection attempts, and see what commands were issued after a successful login.

The main takeaway regarding what we found is just how often root is used as the username in SSH brute force attacks. In fact, just over 64% of the SSH login attempts made on our honeypot were using root. I won’t be so brazen as to claim that 64% of the entire world’s SSH login attempts use root, but it is an alarming percentage even in a research scenario. If you could invalidate 64% or even half that percentage of attacks on your SSH-enabled systems, why wouldn’t you? Just why is root the low hanging fruit when it comes to attempted SSH logins? Well, it’s guaranteed to exist, and compromising the account gives you total and complete control over the system. Of course there are other ways to restrict SSH traffic using firewalls or VPN technologies, but if you aren’t very network savvy, disabling root access for SSH is a quick and achievable goal. Sometimes I think of the username as almost a sort of password. Of course a username is usually much easier to come across, since they are typically stored in plaintext or viewable by other users on a machine. But as far as a random brute force attack on an SSH service goes, it’s just another piece of information that the attacker isn’t likely to have in advance. So, feel free to create a custom account for SSH that isn’t something you’d expect someone to guess.

On the other end of the SSH login we have the password itself. The top passwords in use were very simple, as expected. “123456” was our top password, with “password” trailing behind in second place. “qwerty”, “test”, and “root” also make an appearance shortly after. It should go without saying that you shouldn’t use a simple password. Application and hardware-specific default usernames and passwords should also be changed or disabled–hackers and hacking tools take these into account.

Creating a strong password and restricting SSH access to specific users should always be one of the first steps to hardening an SSH service. Go forth and lock down your SSH service!

How To Use grep To Parse A Linux DHCP Lease File

If you’re using a Linux solution for your DHCP server, you can use cat and grep to quickly locate the IP address of a particular host based on their hostname. On our OpenSUSE Linux DHCP server, the DHCP lease file is stored at /var/lib/dhcp/db/dhcpd.leases. CentOS/Red Hat Enterprise Linux has the lease file at the same path minus the “db” directory, so it is at /var/lib/dhcp/dhcpd.leases. If we run a tail or cat on that log file, we can see some examples of a lease:

tail -27 /var/lib/dhcp/db/dhcpd.leases

This command will display the last 27 lines of the specified file, which happens to be the lease file in this case. The output we receive is seen below:

lease 10.10.0.216 {
starts 2 2013/06/25 00:03:59;
ends 3 2013/06/26 00:03:59;
binding state active;
next binding state free;
hardware ethernet 00:50:56:a3:44:2b;
uid “\001@l\217’\361\021”;
client-hostname “Frodo”;
}
lease 10.10.0.210 {
starts 2 2013/06/25 00:04:04;
ends 3 2013/06/26 00:04:04;
binding state active;
next binding state free;
hardware ethernet 40:6c:8f:27:f1:11;
uid “\001@l\114’\214\219”;
client-hostname “Bilbo”;
}
lease 10.10.1.1 {
starts 2 2013/06/25 00:08:09;
ends 3 2013/06/26 00:08:09;
binding state active;
next binding state free;
hardware ethernet 7c:6d:62:bf:87:e6;
uid “\001|mb\277\207\346”;
client-hostname “Aragorn”;
}

There are three leases for three different hosts shown above. Depending on your network there may be hundreds of leases, if not more, so searching  through them manually is a pain. Now that we know the format of the leases, we can use cat, pipe it to grep with some arguments, and find the IP address of a particular host using the hostname. Here’s the command we will use:

cat /var/lib/dhcp/db/dhcpd.leases | grep Bilbo -B 7 -A 1

In this command, cat will display the entire contents of a file on the screen, but then using the special character “pipe” (seen between “leases” and “grep”), we send the output of the cat command to the grep command. grep will print the entire line containing any string (text) that matches the string we supply. In this case, we have supplied the string, “Bilbo”, since that is the hostname we are hypothetically looking for. Without the -B 7 and -A 1 arguments, the output of the command would be only a single line:

client-hostname “Bilbo”;

But since we did use -B 7 and -A 1 arguments, we will receive the client-hostname line along with the 7 lines immediately above it and the 1 line directly below it:

lease 10.10.0.210 {
starts 2 2013/06/25 00:04:04;
ends 3 2013/06/26 00:04:04;
binding state active;
next binding state free;
hardware ethernet 40:6c:8f:27:f1:11;
uid “\001@l\217’\361\021”;
client-hostname “Bilbo”;
}

The curly bracket below the client-hostname line isn’t exactly important information–I’m just showing an example using both the -A and -B arguments. Finally, we’ll see how to display only the information we are looking for: the hostname and the IP address. What we need to do is use a grep command to match two different strings instead of just one. For that, we will use egrep, a special use of grep which allows us to use regular expressions. The command looks like this:

cat /var/lib/dhcp/db/dhcpd.leases | grep Bilbo -B 7 -A 1 | egrep 'Bilbo|lease'

It is the same command until the second pipe, where we use egrep to match both “Bilbo” and “lease”. Notice that this command uses single quotation marks. Now our output is nice and clean, and only relates the two pieces of information we care about:

lease 10.10.0.210 {
client-hostname “Bilbo”;

If we have more than one entry for “Bilbo”, the last one is the current or most recent entry. And that’s it for this article! Of course, if you had a client management solution which kept track of all client IP addresses, you wouldn’t even need to do this. But this method definitely beats walking a user through opening cmd.exe and typing ipconfig and reading you their IP address! You could also use a program like Angry IP Scanner to scan your network and resolve IP addresses to hostnames.

Are Shortened URLs Safe?

Shortening a URL allows you to condense a long, obnoxious looking web address down to just a few characters and also allows tracking of visitors to that URL depending on which URL shortening service you use. But on the user side of things, do you really know what’s behind a shortened URL? With a normal link, you’re able to see where your browser will be directed by hovering over the link and viewing the information bar at the bottom of the window, regardless of what the hyperlink text is. While you don’t have any guarantee that you’ll end up at your intended destination and that your destination is malware free, you’re taking even more of a risk every time you click a shortened URL. Like most things in this world, shortened URLs are a trade off between convenience and security. For those links you find extra suspicious, try “unshortening” them with http://unshort.me before making that click. The site claims to be able to “unshorten” URLS shortened with the bit.ly, goo.gl, fb.me, t.co services and others. Will you use this before following every shortened link you want to click? I doubt it. But it can be handy for those links that you don’t quite fully trust. All it takes is one bad link and a browser exploit to compromise your security. Here’s to safe surfing!