How To Get DNS When Internal DNS Servers Are Down

A few months ago, a coworker and I had to come in on a Saturday and replace a line card in our core Cisco switch. Of course the card that went down was the one connecting our VM infrastructure, so all of our core services went down with it (maybe there shouldn’t be a single point of failure for this…food for thought?). We were able to quickly restore connectivity up to the Internet, but our DNS servers were all VMs which had been knocked offline, and DNS is very handy to have when you’re interested in using Google services, Cisco articles and blogs to research information you need to get the network back online. My solution was to use Google’s public DNS server, which is located at the conveniently memorable IP address 8.8.8.8 (there’s a backup at the slightly less memorable 8.8.4.4). If your DHCP server is still running (ours wasn’t), you can just change the DNS servers on the clients without disturbing the IP address lease like in the screenshot below.

googlednssettings

Notice that I haven’t disturbed the radio button for “Obtain IP address automatically” but that I’ve set static DNS server entries with the “Use the following DNS server addresses:” radio button. Hopefully you won’t have to do this for everyone in the office, but those critical staff members who need to browse immediately (you know…the person paying you) can be set up this way temporarily. Another option you have if DHCP is still running is to change the DNS servers option in your DHCP scope so that 8.8.8.8 and 8.8.4.4 are being offered first, then force a DHCP Request from the clients. The command to do this from the client side is:

ipconfig /renew

So you could run that via whatever client management software you’re using, or have your intern type it in manually on all the workstations if you don’t have that capability. If you lack an intern and have users who aren’t tech savvy enough to confront the terrifying gray and black text window, you could just tell them to restart their computer and that should force a DHCP Request as well. If your DHCP server isn’t running, you’ll need to set a static IP address for computers that haven’t held onto a lease in addition to setting the DNS servers client-side. Hopefully one of these band-aid fixes will at least be enough to make someone happy or make your life easier while you’re working on bringing the internal DNS server back up. Best of luck!

Wireshark 101 – The Interface

Welcome back to Wireshark 101! Last week I wrote an article that hopefully got you interested in Wireshark, and this week I’ll walk you through installing it and getting some exposure to the interface. Recall my caveat about not using Wireshark at work, school or any other place where you aren’t explicitly permitted to do so. With that in mind, let’s install Wireshark and take a short tour.

The latest version of Wireshark can always be downloaded from www.wireshark.org. We’ll be using Wireshark 1.12 which was released on July 31, 2014. The download link should be at the bottom left of the page. Just grab the version that’s appropriate for you–I’m using the 64-bit version of the Windows installer for this article. If you’re running Mac OS X, your interface will look a little different but for the most part it’s pretty similar. Upon running the installer, you’ll be faced with some check boxes on the “Choose Components” window. I’m leaving everything checked except “Wireshark 2 Preview”. On the following windows, “Select Additional Tasks” and “Choose Install Location”, we can use the default settings. Leave “Install WinPcap 4.1.3” checked on the “Install WinPcap?” window and then choose “Install”. Another installation process will be launched for WinPcap and “Automatically start the WinPcap driver at boot time” can be left checked. After that WinPcap is done, Wireshark will finish up installing and you’ll have the option to go ahead and run it!

wiresharkinitial

You’ll be greeted with a screen that looks pretty much like the screenshot above. The section titles speak for themselves here. We have a capture section, a capture help section, a files section and an online help section. You won’t normally spend much time on this window, so let’s continue on and get to the real interface that you’ll come to know as home! Under “Capture”, choose the “Local Area Connection” interface and then click the green shark fin just above it. Note: if you’re on a laptop, you’ll need to select a wireless interface. I am not sure how they are differentiated. If all went as planned, you’ll be taken to a new interface similar to the one below.

capturewindowcolors

Oh no, information overload! Depending on how noisy your computer or network is, you should start seeing a list of rows with different numbers and colored backgrounds fly by pretty soon. If your window doesn’t look something like mine after about 30 seconds, you might have chosen the wrong capture interface or maybe you just aren’t generating any network traffic. My suggestion is to try minimizing Wireshark and browsing to a webpage, something like www.google.com. When you come back, you should have some packets. If you don’t, you need to select a different capture interface by clicking the “List the available capture interfaces…” icon which is two icons to the left of the green shark fin at the top of the window. Check the box for a different interface than the one that’s selected and click “Start” and “Continue without saving”.

Once you’ve got a few packets captured, press the red stop button to the right of the green shark fin icon near the top. Now we can take a look at each part of the user interface at our leisure. The top section with the columns such as “No.”, “Time”, “Source” and “Destination”, as well as the rows for each packet, is known as the packet list pane. As you might guess, it lists the captured packets along with some specified details of each packet in the columns. The middle section is known as the packet details pane. This is where you can get an in-depth examination of one particular packet once it’s selected in the packet list pane. The pane at the bottom with all the 1’s and 0’s is the packet bytes pane, and it shows you the actual binary data as well as an ASCII interpretation of the bytes for the currently selected packet. That means if we were looking at raw HTML from a webpage, for example, we could see that in the packet bytes pane in the ASCII column. With no particular reasoning behind the choice of colors, I’ve outlined the packet list pane in blue, the packet details pane in red, and the packet bytes pane in green in the image above. These panes can be resized if you’d like to adjust the layout–just hover your mouse cursor between two panes until your cursor icon changes, then click and drag to the desired size.

Congrulations! You’ve completed your first packet capture! You can save it if you like by choosing File > Save and choosing a destination, but we won’t be using it anymore. That’s all we are doing for this article! To exit, just click the red “X” at the top right of the window. I know it looks like a lot to take in right now, but we will take it nice and slow while building up our Wireshark skills. In the next article we’ll send some ICMP ping packets, examine one of them from beginning to end and get a handle on how all this information is organized and how we can organize it further.

Wireshark 101 – Introduction

Wireshark is my favorite networking tool and I have used it pretty much on a weekly basis over the past couple of years. Not only has it saved me multiple times at work as I investigate various issues, it’s also allowed me to expand and solidify my knowledge of networking. It’s a wonderful troubleshooting tool and an invaluable learning resource. That’s why I think you should use it whether you’re already working in the networking field or learning the basics as a student.

So, what is Wireshark? Wireshark is a network packet analysis tool. That means we need to define what packets are before we can understand why analyzing them with Wireshark is helpful. Allow me to launch into a long-winded explanation. It turns out that everything your computer sends or receives across a network or the Internet is actually a stream of 1’s and 0’s. That means every picture, every streamed song, every video, and every bit of data that goes into making online computer games work are all comprised of just 1’s and 0’s and nothing more. It might seem a little implausible if you haven’t been exposed to this concept before, but it’s true. The trick is that we use a lot of 1’s and 0’s. For instance, a picture I have saved on my computer that was taken by my cellphone is made up of 2,838,456 1’s and 0’s. Programs that have the capability to render pictures on your computer are able to process that stream of nearly 3 million digits and turn it into something that’s appealing to the eyes.

Now, let’s expand our terminology a little. From now on, we’ll refer to a single 1 or a single 0 as a ‘bit’, and we’ll call any combination of 8 bits a ‘byte’. A byte is a sort of special length of bits that you will see over and over again. A byte can be any combination of bits. Each of these numbers separated by commas are examples of a byte: 00000000, 11111111, 11001100, 11110000, 10101010, 10011010, 01101010. Each of these strings of bits is a byte simply because the definition of a byte is that it is 8 bits in length. There’s also a designation for the length of 4 bits, and it is somewhat humorously referred to as a nibble (it’s half of a byte…get it?).

Groups of bytes that are sent across a computer network are referred to as packets–we finally made it to the definition of a packet, whew! Inside a packet, there may be different sections of bytes for different purposes. For instance, when downloading a picture from a website, the bytes that ultimately make up the picture itself are of course present in the packets. But there are other bytes in the packets as well, for example bytes that are used to make sure that the packet arrives at the correct location (like your computer), and bytes that are used to make sure the packets are reordered correctly once they are received (so your picture isn’t a jumbled mess of pixels). In other words, there are different layers to each packet–packets aren’t just comprised of the data they are trying to convey.

The bytes in each layer of a packet define information based on what protocol is being used at that layer. As an example, let’s look at something called Ethernet protocol. Unless you are on a wireless connection, your computer is likely is plugged into a network using a Cat5 cable (they are typically blue cables with a tabbed connector on the end, although the color doesn’t actually matter). That being the case, there’s a 99.99 percent chance that your computer attaches Ethernet protocol information known as an ‘Ethernet header’ to the front of every packet it sends. Ethernet is a pretty simple protocol used to provide a source and destination address for packets on a local network. It also defines the protocol of the bytes that are following directly after the Ethernet header. Because Ethernet is strictly defined, we know that the first 6 bytes of data will be interpreted as a destination address, the next 6 bytes following will be interpreted as a source address, and the next 2 bytes following will be interpreted as a statement of the protocol type of data following the Ethernet header. So, the Ethernet header is 14 bytes in length and has 3 pieces of important information.

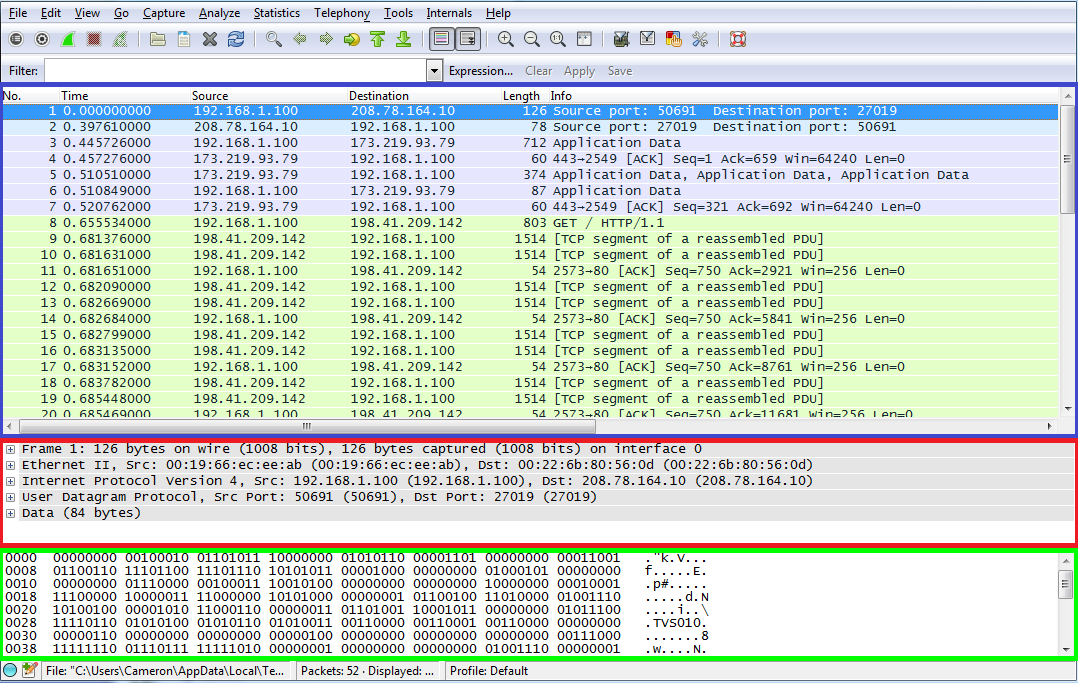
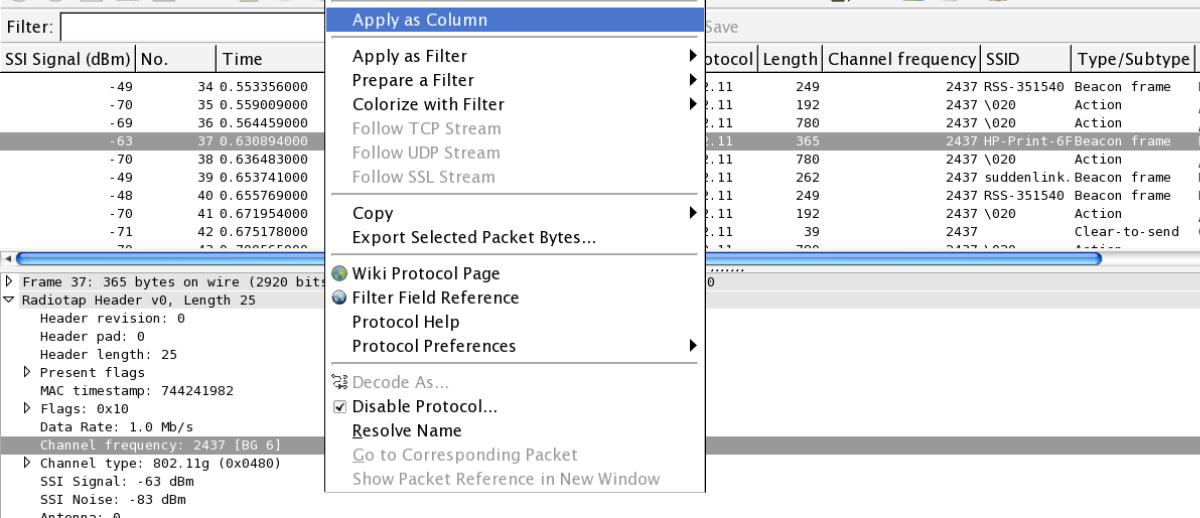
Did you think I had forgotten that this was supposed to be an article about Wireshark at this point? Well, I haven’t! The beauty of Wireshark is that it automatically interprets all of this information from many different protocols and displays it in a hierarchy for you for each packet. If you were looking at the raw data for a packet and wanted to interpret the Ethernet header portion, you’d be examining the blue stream of bits below.

wiresharkbits

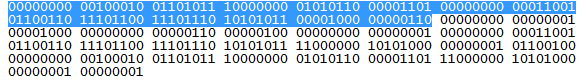
That looks like fun, doesn’t it? Anything look familiar to you? Maybe it’s the fact that there are 14 groups of 8 bits, or 14 bytes outlined in blue. Remember that 14 bytes is the length of the Ethernet header which is placed at the beginning of a packet. Now we’ll look at Wireshark’s interpretation of this information.

wiresharkethernet


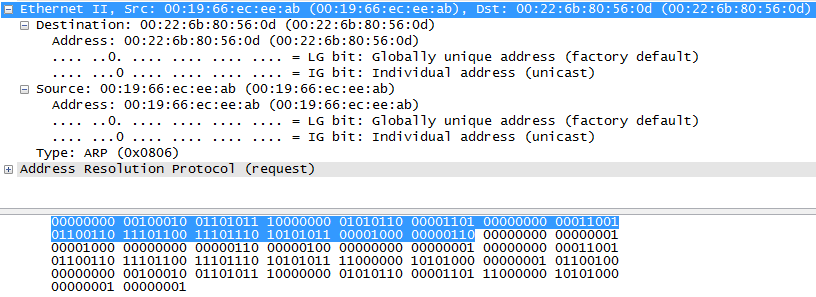
Whoa, hey! Are those English words in that picture? Why yes, they are! As you can see, we have selected and expanded the Ethernet header portion of a packet and we can now see that the destination address is “00:22:6b:80:56:0d”, the source address is “00:19:66:ec:ee:ab”, and the type of protocol that is coming up next in the packet is ARP or Address Resolution Protocol.

But Cameron, you might say, that still looks like nonsense to me! How the heck does “00:19:66:ec:ee:ab” tell me anything more than “00000000 00100010 01101011 10000000 01010110 00001101”? Well, honestly, it won’t just yet if you don’t understand what a source and destination address are used for in the Ethernet header and how it is derived into human readable text from the bits themselves. But in the future, when you do know, Wireshark gives you the capability to quickly find this information in every packet.

And remember when I said it takes a lot of 1’s and 0’s for our enjoyment of computer networks? Well, Wireshark can prevent the “needle in a haystack” issue of searching for problematic packets among the thousands or millions that you might capture in a single capture session by providing efficient search options. For example, even if I have captured a million packets in a single capture session and I wanted to find the one packet with a destination address of “00:19:66:ec:ee:ab”, I can create a display filter in five seconds which will allow me to find that packet and analyze its contents. You could create a filter which will show you all traffic to a particular computer, or all traffic for a particular service (port), or all traffic which contains a specific value of a particular protocol, or any combination of these (e.g. all traffic to a computer which is sent to a particular port and contains a particular value), and many, many more.

There are a multitude of other reasons to use Wireshark, but I hope this article has at least piqued your interest. As a student, I found it difficult to relate to the information I was seeing in Wireshark and didn’t realize the potential for learning until after many grueling and tedious Wireshark sessions. Now I love this thing because it actually helps me fix issues.

A final disclaimer about Wireshark: don’t use it on any network that you don’t have explicit, preferably written permission to do so. You can get into some legal trouble or get fired from your job if you aren’t careful about where you capture packets.


How To Use Wireshark on a Mac to See 802.11 Headers and Find Wireless Devices

In this post, we are going to use the Airport NIC on a Macbook Pro or Air in order to view 802.11 and Radiotap headers using Wireshark. Utilizing the Airport card we can gain access to some useful layer 2 wireless information including signal strength, channel frequency and data rate, and see interesting packets such as beacon frames as well. Let’s have some fun!

The first step is to own a Macbook Air or Macbook Pro with an Airport card. Unfortunately, the vast majority of laptops natively running Windows won’t allow you to see layer 2 wireless information, as it is a restricted function of the NIC. You can technically still get access to the same information with a Windows laptop, but you’ll need a third party device such as Riverbed’s AirPcap. Spoiler alert: they are pretty expensive!

The next step is to download Wireshark from www.wireshark.org. Wireshark is a packet analysis tool–probably the best in the industry–and it has the added benefit of being free and open source! I’m using Wireshark version 1.10.6 on Mac OS X 10.9.3 (Mavericks) for this tutorial. When you launch Wireshark for the first time, it will need to configure a graphics utility named XQuartz in order to run, and that can take several minutes. While we are waiting, let’s make a configuration change that will allow us to interact with the Airport card.

Mac OS X has a built-in command line utility that will allow us to configure the Airport card, but it’s not in an easy to access place. We’re going to fix that by typing the following command in Terminal:

sudo ln -s /System/Library/PrivateFrameworks/Apple80211.framework/Versions/Current/Resources/airport /usr/sbin/airport

Let’s break down the command:
sudo – run the following command as the root user
ln – create a link from the second file to the first file
-s – supplied to the ln utility to denote that this will be a “symbolic” link. That means when we refer to /usr/sbin/airport, it points to /System/Library/PrivateFrameworks/…/airport, but we don’t need to disturb the current location of the file.

The last piece of important info is that we created the symbolic link in the /usr/sbin directory, which allows us to run the command without having to specify the full path. In other words, now we have an airport command. Neat!

If you type airport by itself and press enter, you will receive some information about using the airport utility (for any other use of the airport command, we will need to type sudo in front of it to run it as the root user). We are most interested in the -z and -c arguments. For instance, if you type sudo airport -z, it will force disassociation with any wireless networks that the Mac is connected to. We need to do that first in some instances so that we can specify what channel or frequency of traffic we want to capture with the -c command. This is because the Airport NIC can only capture traffic from one frequency at a time, so if it is associated with a wireless SSID, you will be forced to capture traffic on the frequency that SSID is operating on. In order to capture traffic on the most common 2.4 ghz channels, we can type sudo airport -c1, sudo airport -c6, or sudo airport -c11 in order to capture traffic on channels 1, 6, or 11 respectively. We can also select 5 ghz channels, with sudo airport -c157 for example. See more about wireless network channels here: http://en.wikipedia.org/wiki/List_of_WLAN_channels.

Screen Shot 2014-08-30 at 9.10.17 AM

Hopefully by this point Wireshark is ready to launch, so spin it up! When it opens, you will see a list of interfaces on the left-hand side of the screen, such as “Wi-Fi: en0”, and “Thunderbolt1: en1” (if you have a Thunderbolt port). Double click on “Wi-Fi: en0”, make sure the boxes are checked for “Capture packets in promiscuous mode” (capture packets that aren’t addressed specifically to our Mac) and “Capture packets in monitor mode” (allow us to see 802.11 and Radiotap headers), then choose “OK”. Now start a new live capture by clicking the green shark fin near the top left of the Wireshark window. If there are any wireless devices communicating on the frequency that your Mac is listening in on, you should begin to see packet data in the middle pane. If you don’t, try changing the frequency using the terminal commands in the previous paragraph. Remember that you will not see any traffic if you are not tuned into a wireless channel that is in use near your Mac.

Screen Shot 2014-08-30 at 9.27.42 AM

The default columns don’t reveal much of the information we are seeking, so let’s edit them. If the packets are scrolling by too fast for you, click the red stop button near the green shark fin button you clicked earlier. Click on one of the packets in the packet list pane so that the packet is horizontally highlighted, then move your attention to the pane below which is known as the packet details pane. Click the little arrow to the left of “Radiotap Header …” and you should see some information such as “Data Rate”, “Channel frequency”, “Channel type” etc. Some interesting pieces of information we may wish to add to the available columns are the channel frequency and SSI signal. The channel frequency is the actual frequency number which corresponds to the short channel name. For example, channel frequency 2437 corresponds to channel 6. SSI stands for “Signal Strength Indicator” and this value tells us how strong the received signal was on a particular packet. If we ignore the negative sign, we can simply say that the lower the number, the better the signal strength is. For example, an SSI of -60 indicates a stronger signal than -80. To add these pieces of information as columns, right click on each field and select “Apply as Column”. Now this information is easily accessible from the packet list pane and we won’t have to dig for it in the packet details pane. If you’d like to rearrange your columns, feel free to do so by left clicking the column name and dragging it left or right.

Let’s add two more columns. Find a beacon frame by scrolling through the packet list pane until you see one that has “Beacon frame …” in the Info column. Select the packet and left click on the arrow beside “Radiotap Header …” again in the packet details pane so that the information collapses. Now left click on “IEEE 802.11 Beacon frame …”, right click the first field which is “Type/Subtype” and apply that field as a column. Collapse “IEEE 802.11 Beacon frame …” and expand “IEEE 802.11 wireless LAN management frame” by left clicking their respective arrows. Expand “Tagged parameters”, then expand “Tag: SSID parameter set: …” if it is not already expanded. Right-click on “SSID: …” and apply that field as a column. At this point we can see the 802.11 frame type as well as the SSID which originated each packet. If you stopped your packet capture earlier, you can start it again by clicking the green shark fin again.

Now, what can you do with this setup? I have used it to track down printers which are broadcasting their own wireless networks in corporate environments, as well as to track down access points whose physical location was undocumented. You could also use it to locate rogue devices or any wireless client such as a laptop or cell phone. To hone in on a particular device, find a packet which has originated from it, right-click the MAC address of the device in the “Source” column and choose “Apply as filter > Selected”. This will filter out all captured traffic in the packet list pane so that only packets with a matching source MAC address will appear. While you have a live capture running, you can see a very clear indication of how close your laptop is to the device by examining the SSI Signal column we added earlier. In my experience, -80 to -90 indicates a device which is pretty far away but could still be in the same building, -60 to -80 may indicate that you are within 50 feet of a device, -40 usually means you are pretty much in the same room with the device, and -10 to -20 is seen when you are inches away from the device. Take these numbers with a grain of salt, as the power of the source radio and the construction of the building may alter your expected SSI’s. I have also found that pointing the Apple logo on the back of your Mac straight at a device will guarantee the best SSI, so you can use that to your advantage when searching for devices.

Why You Shouldn’t Allow root Login for SSH

A few years ago, a team of students and I did some research on my university’s honeypot network and put together a little presentation about what we found. For those not in the know, a honeypot is a purposefully exposed network system intended to either divert the attention of hackers from production systems or gather information about how hackers compromise systems and the tools they use to do it. While we did gather some information about various default ports that were scanned and attacked, the main focus of the project was on SSH. By using Kippo, a specially designed SSH honeypot service, we were able to acquire information about the usernames and passwords that were used to make SSH connection attempts, and see what commands were issued after a successful login.

The main takeaway regarding what we found is just how often root is used as the username in SSH brute force attacks. In fact, just over 64% of the SSH login attempts made on our honeypot were using root. I won’t be so brazen as to claim that 64% of the entire world’s SSH login attempts use root, but it is an alarming percentage even in a research scenario. If you could invalidate 64% or even half that percentage of attacks on your SSH-enabled systems, why wouldn’t you? Just why is root the low hanging fruit when it comes to attempted SSH logins? Well, it’s guaranteed to exist, and compromising the account gives you total and complete control over the system. Of course there are other ways to restrict SSH traffic using firewalls or VPN technologies, but if you aren’t very network savvy, disabling root access for SSH is a quick and achievable goal. Sometimes I think of the username as almost a sort of password. Of course a username is usually much easier to come across, since they are typically stored in plaintext or viewable by other users on a machine. But as far as a random brute force attack on an SSH service goes, it’s just another piece of information that the attacker isn’t likely to have in advance. So, feel free to create a custom account for SSH that isn’t something you’d expect someone to guess.

On the other end of the SSH login we have the password itself. The top passwords in use were very simple, as expected. “123456” was our top password, with “password” trailing behind in second place. “qwerty”, “test”, and “root” also make an appearance shortly after. It should go without saying that you shouldn’t use a simple password. Application and hardware-specific default usernames and passwords should also be changed or disabled–hackers and hacking tools take these into account.

Creating a strong password and restricting SSH access to specific users should always be one of the first steps to hardening an SSH service. Go forth and lock down your SSH service!